


The British pound has slipped to its weakest level since late June, with GBP/USD trading in the $1.3210 to $1.3220 area during Friday's session as broad dollar strength continued to weigh on sterling. The pair has fallen from roughly $1.3645 on August 21 to current levels, a decline of about 420 to 425 pips, or approximately 3.1 percent, over the past five weeks. The move reflects a steady grind lower rather than a single sharp break, and it has pushed Cable down toward a chart level that traders have been watching closely.
The driver behind the slide is largely a story about US interest rates. The 10-year Treasury yield has pushed up toward the 5.2 percent area, trading near 5.17 percent as of Friday, after climbing steadily through September. Interest-rate futures were pricing in roughly a 70 to 75 percent probability of another quarter-point Federal Reserve hike at the central bank's October meeting, up from meaningfully lower odds earlier in the cycle. Higher US yields make dollar-denominated assets more attractive relative to sterling, and that rate differential has been the single biggest pressure point on GBP/USD through the recent slide.
The dollar's broader strength this month is not unique to its move against sterling. A basket-wide dollar index has also pushed toward multi-week highs, reflecting the same rate-differential story that has weighed on GBP/USD. That means sterling's decline should be read partly as a dollar story and partly as a UK-specific one, rather than purely a reflection of weakness inside the UK economy.
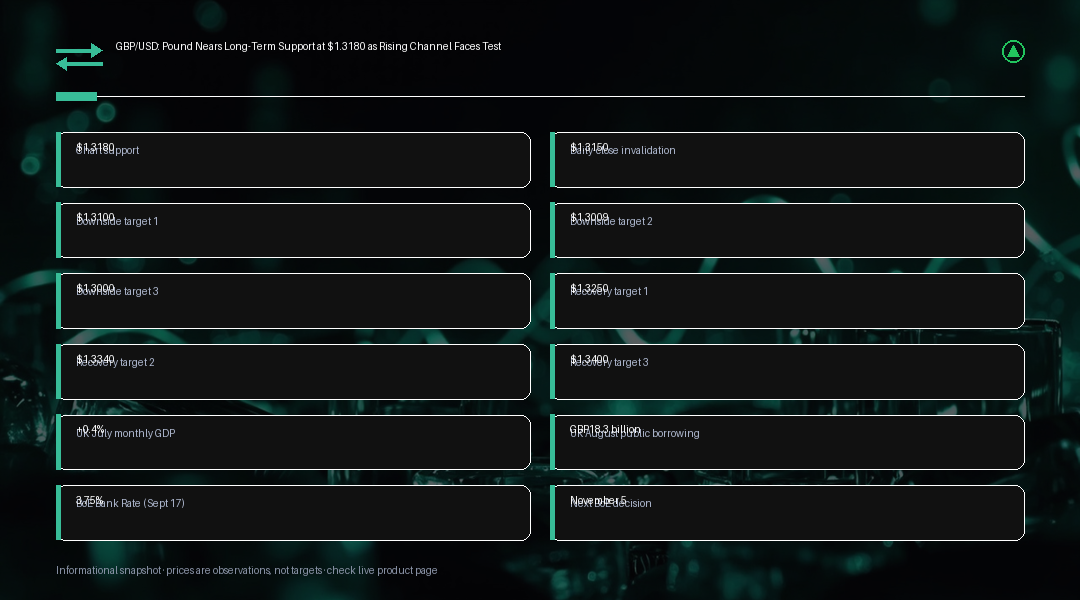
UK data has offered a mixed picture rather than a clear escape route for the pound. Monthly real GDP expanded 0.4 percent in July, a reading that would normally support sterling on its own. That was offset, however, by a fiscal signal cutting the other way: public sector net borrowing reached GBP18.3 billion in August, roughly GBP3.5 billion above the Office for Budget Responsibility's forecast and about GBP2.9 billion higher than the same month a year earlier. The bigger-than-expected shortfall lands just ahead of the government's upcoming autumn budget and tightens the room the Treasury has to maneuver, an unhelpful backdrop for a currency already on the defensive.
The Bank of England, for its part, held Bank Rate at 3.75 percent at its September 17 meeting, with the vote split 6 to 3 in favor of holding and three members preferring an immediate hike. Its next scheduled decision falls on November 5. Persistent energy-price pressure is sometimes cited as a reason the BoE could eventually be forced toward a more hawkish stance, since Britain remains a meaningful energy importer, but that link is best treated as a conditional risk scenario rather than a settled outcome. Any near-term move by the BoE will depend heavily on how UK inflation and wage data evolve between now and that November decision.
On the chart, the level traders are focused on is $1.3180, the lower boundary of a long-term ascending channel that has framed GBP/USD's broader uptrend. The same trendline connects a November 5 low near $1.3009 with a June 24 touchpoint around $1.3136, and because the line rises over time, its relevant support level has crept higher with every test. That makes $1.3180 more than a simple horizontal marker. It is effectively the point at which the broader multi-month uptrend needs to attract fresh buying if the channel structure is to stay intact.
An intraday dip below $1.3180 would not, on its own, invalidate the setup, since trendlines rarely behave like perfectly measured floors in practice. A daily close below $1.3150, however, would be a stronger signal that sellers have actually broken the channel rather than briefly testing it. A confirmed breakdown of that kind could open the door to $1.3100 as an initial target, followed by the November touchpoint near $1.3009 and the psychologically significant $1.3000 level below that. Losing the channel would also risk trapping recent dip-buyers, which could add to selling pressure if stop-loss orders begin to trigger in a cascading move.
If the $1.3180 zone instead holds and buyers step back in, the first recovery targets sit around $1.3250 and $1.3340, levels where recent breakdowns previously occurred on the way down. A reclaim of $1.3340 would ease some of the immediate bearish pressure on the pair, though GBP/USD would likely need to climb back above $1.3400 before the broader five-week decline starts to look meaningfully repaired rather than simply paused.
Looking ahead, traders will be watching the UK's autumn budget for signals on fiscal policy and any market reaction to further borrowing detail, alongside the Bank of England's November 5 decision and incoming US inflation and labor data that will shape the Federal Reserve's own October decision. Any of these events has the potential to accelerate or reverse the current trend, and traders positioning around the $1.3180 support zone should treat that calendar as a source of event risk rather than assume the technical picture will play out in isolation.
This is not the first time this year that GBP/USD has tested a major trendline after a multi-week dollar rally, and previous episodes have generally resolved in one of two ways: either a sharp reversal once positioning became stretched, or a clean break that opened the next leg of the prevailing trend. What makes the current test slightly different is the amount of event risk clustered close together, with the UK budget and the Bank of England's November decision both landing within a few weeks of each other, alongside a US central bank that itself remains in an unusually live tightening debate. That combination raises the odds of a sharper, catalyst-driven move rather than a slow grind in either direction.
The move in sterling has not been isolated to the currency market. UK gilt yields have tracked the broader global bond selloff, and a weaker pound alongside higher domestic borrowing costs is a combination the Treasury will be watching closely heading into the budget. For equity traders, a softer pound has historically been a mild tailwind for globally focused, dollar-earning constituents of the FTSE, even as it raises import costs for the wider UK economy. None of this changes the core technical setup on GBP/USD itself, but it is part of the same macro story driving the pair toward $1.3180.
For now, the wider macro backdrop still leans dollar-positive, so the $1.3180 trendline is best treated as a potential inflection point to watch rather than a guaranteed floor. After shedding roughly 3 percent over five weeks, sterling has reached a juncture where price action over the coming sessions should go a long way toward showing whether the current move is exhausted or simply catching its breath before another leg lower. Technical levels of this kind describe a scenario, not a certainty, and traders should weigh them alongside incoming UK data, US rate expectations, and their own risk tolerance rather than as a standalone signal. Nothing here should be read as personal financial advice.
Trading Insight
For active traders, $1.3180 is the level that matters most right now. As long as GBP/USD holds a daily close above it, the broader ascending-channel structure that has framed this multi-month uptrend stays technically intact, and dip-buyers are likely to keep treating pullbacks toward that zone as a buying opportunity with recovery targets at $1.3250 and $1.3340. A confirmed daily close below $1.3150 would flip that read, opening a path toward $1.3100 and then the $1.3009 to $1.3000 area, and would also risk trapping recent buyers into forced selling if stop-loss orders start to trigger. Around this setup, the UK's upcoming autumn budget, the Bank of England's November 5 decision, and incoming US inflation and labor data are all realistic catalysts that could move the pair well before the chart resolves on its own, so position sizing and stop placement matter as much as the level itself.