


Bitcoin spent the late-July 2026 window reclaiming and retesting the 50-day moving average near the mid-$65,000s after bouncing hard off the early-month trough. The useful read is not “every 50-day reclaim must rally.” It is a three-leg map: what the short-term average actually measures, whether price accepts above it after the first print, and how that repair still sits under broken higher moving averages — with social pattern samples kept in the history column, not the forecast column.
For live core-crypto pricing while that structure is tested, see the BTC product page and the ETH product page.
Key takeaways
- A 50-day MA reclaim is a short-term trend-filter repair near the mid-$65ks — not proof of a finished cycle bottom or a free pass through higher resistance.
- Social desks cite prior reclaim legs (roughly +10% / +10% / +20% class samples across late-2025 and early-2026 windows); those are observed history, not a guarantee the next leg rhymes.
- Watch acceptance above the 50-day zone, the still-overhead 100-day and 200-day stack, and whether the late-July ETF bid stays constructive — any leg can fail independently.
What does reclaiming the 50-day moving average actually mean?
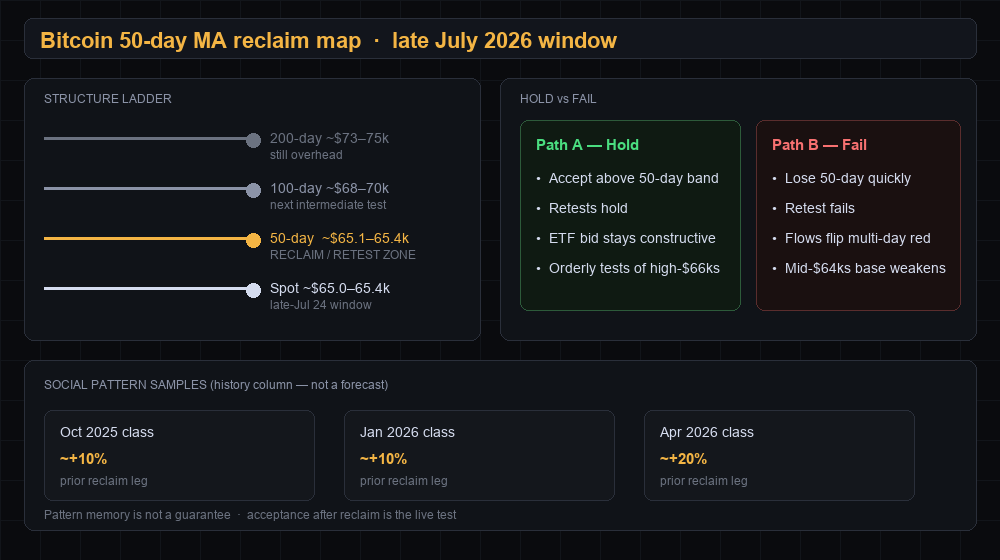
It means the market’s short-term average cost of the last ~50 sessions just stopped sitting cleanly above price — a constructive filter flip, not a new all-time-high story. In daily technical stacks published on July 24, 2026, bitcoin was trading near the $65,000–$65,400 class while the 50-day average clustered around roughly $65,070–$65,430 (about $65,143 on one widely used EMA print). Different feeds use SMA vs EMA and slightly different closes, so treat the zone as a band, not a single tick.
Context is what makes the reclaim useful. CoinStats-class session notes put the weekly high near $66,840 on July 21 after a rebound of roughly 13% from an early-July low near $57,750. Market-desk posts on July 21 also framed the move as the first clean 50-day reclaim since late May. That sequence matters: strength first printed into the high-$66ks, then price came back to test the filter it had just cleared. A reclaim that only exists as a one-hour wick is weaker than a reclaim that holds on a retest. For how recovery highs can still sit deep under a cycle peak, see the mid-$66k five-week high map.
Do past 50-day reclaims guarantee another rally?
No — past reclaim legs are samples of history under different flow and macro regimes, not a contract for the next percentage move. In the July 24 social wave that powered this radar topic, pattern accounts highlighted prior “bear market” 50-day reclaims followed by roughly +10% (October 2025 class), +10% (January 2026 class), and +20% (April 2026 class) legs, with spot near $64,900 in one widely shared post. Those numbers travel well on X because they are scannable. They do not control selection bias, how many failed reclaims were ignored, or whether leverage, ETF creations, and rate-path headlines looked anything like today’s tape.
The trader translation is simple. Pattern memory can be a hypothesis generator (“if acceptance holds, prior rebounds sometimes extended”). It is a poor substitute for a live invalidation. A first print above the 50-day that fails within a session is information that the short-term filter is still contested — not a moral failure of the bull case, and not proof the social sample set was “wrong forever.” Treat the percentage folklore as a footnote next to the acceptance test, not as the thesis itself.
Why do the 100-day and 200-day averages still matter?
Because a short-term repair inside a larger downtrend is common — and late-July desks still show bitcoin below the intermediate and long moving averages that mark broader trend repair. On the same July 24 technical stacks, the 100-day region sat near the $68,000–$70,000 class and the 200-day region near roughly $73,000–$75,000, while the October 2025 cycle high still sits near the $125,000–$126,000 class. Clearing the 50-day does not erase that ladder. It only says the most recent month-and-a-half of trade is no longer crushing every bounce by definition.
Capital path is the optional second confirmation. Flow recaps into July 23 described a multi-day U.S. spot bitcoin ETF inflow stretch on the order of roughly $800 million to $1 billion over about seven sessions, led in several sessions by BlackRock’s IBIT — constructive after June’s heavy outflow month, but still small next to year-to-date damage and still capable of flipping session by session (small net outflow notes around the July 23–24 window were already in the same recaps). Flows do not redefine the moving average. They do help answer whether acceptance above the 50-day has a slower bid behind it. For the longer “cycle rhyme vs floor” framing, see Bitcoin’s late-2021 chart rhyme map.
What should traders watch next?
Watch acceptance, the higher-MA ladder, and the flow path independently — and let each fail on its own evidence.
Scenario A — hold and acceptance. Price spends time above the mid-$65k 50-day band, retests do not produce a clean daily breakdown, and the ETF bid stays net constructive or only lightly choppy while tests of the high-$66ks / low-$68ks stay orderly rather than cascading. In that path, the 50-day reclaim looks like the start of a short-term repair phase that can later challenge the 100-day region — still not a verdict on the full cycle.
Scenario B — failed reclaim. The 50-day band is lost quickly after the first green prints, retests fail, and price slips back toward the mid-to-high $64,000s base while ETF days flip red and higher averages remain distant overhead. In that path, the “reclaim” was a temporary filter cross — useful information that sellers still own the intermediate structure. Scenario A fails quickly if acceptance never forms. Scenario B fails quickly if spot reclaims and holds the 50-day again with improving breadth rather than a single wick.
Structure dashboard
| Lens | Window print | Trader read |
|---|---|---|
| Bitcoin spot | ~$65,000–$65,400 class (Jul 24, 2026 desks); weekly high ~$66.8k (Jul 21) | Retest after reclaim, not a quiet grind |
| 50-day MA zone | ~$65,070–$65,430 / ~$65,143 class (CoinStats-class Jul 23–24 stacks) | Short-term filter — band, not a single tick |
| Reclaim framing | First clean 50-day reclaim since late May (Jul 21 market-desk notes) | Milestone only if acceptance follows |
| Bounce from July trough | ~13% class above early-July low near ~$57.8k | Repair has size off the floor |
| 100-day / 200-day | Still overhead (~$68–70k / ~$73–75k class) | Intermediate structure still challenged |
| Social pattern samples | Prior reclaim legs ~+10% / +10% / +20% (late-2025–early-2026 social desks) | History column — not a guarantee |
| Spot BTC ETF path | Multi-day inflow stretch ~$800M–$1B class through Jul 23; choppy day notes Jul 23–24 | Optional capital confirmation; can fade |
| Cycle context | Still deep under Oct 2025 high ~$125k–$126k class | 50-day repair ≠ cycle high story |
Figures are observation windows from public market and technical desks — not live quotes. MA values differ by SMA/EMA and feed. Live pricing: BTC · ETH.
Final thoughts
A 50-day moving-average reclaim only becomes useful when you know which question it answers. In this late-July window, it answers a short-term filter question near the mid-$65,000s after a bounce off the early-month floor — not whether every prior social sample must reprint, and not whether the 100-day and 200-day ladder has already been cleared. Keep the three-leg map in view: definition of the filter, acceptance after the reclaim, and higher structure still overhead. Update it as the next retest and the next flow day land, and treat pattern folklore as context rather than a promise of the next percentage move.