


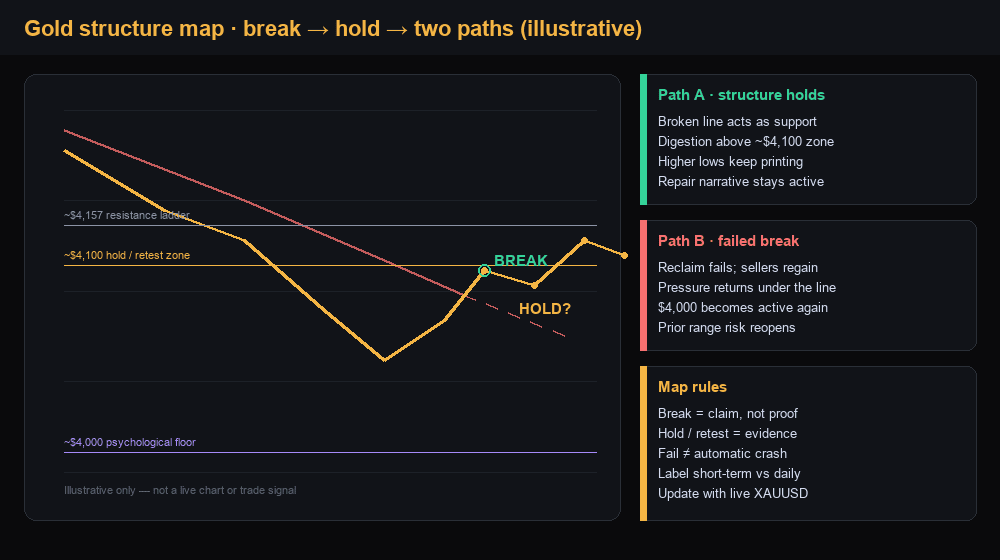
Retail charts are saying the quiet part out loud: gold has broken a downtrend line — if the price holds this level, the repair can continue; if it fails, the prior selling regime is still in charge. The useful map is not “break equals moon, fail equals crash.” It is a three-step structure read: break → hold / retest → what the broader map still allows.
For live precious-metals pricing while that debate plays out, see the XAUUSD product page. For a related cross-asset risk map from the same macro week, see Nasdaq futures and oil risk-off.
Key takeaways
- A short-term downtrend break is step one; holding the break (or the retest) is what turns a wick into structure.
- Mid-July desks put the fight near ~$4,100 with ~$4,000 still the psychological floor — not a magic crash switch.
- Watch two paths: held repair above the broken line vs failed break and renewed pressure on the $4,000 zone.
What does “gold broke the downtrend” actually mean?
It means price has moved through a descending resistance line that had been capping the recent bounce — not that the entire multi-month correction is automatically over. On social feeds, that idea often arrives as a single screenshot and a binary caption. On a trading desk, the first job is to label the timeframe: a short-term (session to multi-day) line is not the same object as a daily downtrend drawn from the spring high.
In Economies.com’s July 21–22 technical notes, gold was described as having breached a main short-term bearish trendline, with price attacking the key resistance area near $4,100 while trading above the 50-period exponential moving average, which the desk treated as a dynamic support once reclaimed. That is a repair narrative: sellers who owned the line are being challenged, and the market is testing whether buyers can keep control after the break.
That short-term improvement still sits inside a larger 2026 digestion. Earlier in the summer, FOREX.com analyst Julian Pineda framed the daily bearish trendline in place since March as the dominant higher-timeframe pattern, with broader upside structure still facing resistance near roughly $4,345 and deeper support near roughly $3,886 in that June window. Those levels are not today’s live quotes; they are the map language desks used when the multi-month sell bias was still the main story. The practical takeaway: a short-term line can break while the longer structure is only starting to negotiate a turn.
Why does “if it holds this level” matter more than the break?
Because breakouts fail often — and the hold is how the market proves the break was real. In trader language, a clean break is a claim. A successful retest of the broken line as support is evidence. A failed hold sends price back into the prior range and re-empowers the sellers who defended that line for weeks.
That is why the social phrasing “if the price holds this level” is more useful than the first half of the tweet. LiteFinance’s July 22–23 gold desk put spot near about $4,125 in the July 23 observation window, with nearby support references around $4,114, $4,060, and $4,008, and upside hurdles starting near about $4,157. Those prints move through the day; the hierarchy is what matters: reclaimed short-term structure first, psychological $4,000 next, deeper spring supports only if the floor fails.
Social posts sometimes jump from “fails to hold” to “potential market crash.” That is a category error. A failed break on gold can mean renewed pressure toward the $4,000 psychological zone that mid-year desks (DailyForex-style July outlooks and related washout notes) have treated as a line in the sand after the 2026 correction. It can mean a return to range trading under the old trendline. It does not by itself prove a synchronized global crash. Crash language is loud; structure language is checkable. For a related “cross-asset regime” read when gold lagged while Bitcoin reclaimed mid-cycle levels, see Bitcoin’s mid-$66k reclaim vs gold lag.
What should traders watch next?
Watch whether the broken line becomes support — and whether $4,000 stays a floor rather than a magnet for another probe.
Scenario A — structure holds (repair path). Price digests above the reclaimed short-term line, higher lows form, and pullbacks into the breakout area are absorbed rather than sold aggressively. In that path, the mid-July break becomes more than a wick: the market is treating the old ceiling as a floor, and attention shifts up the resistance ladder desks have been marking above ~$4,100. This path does not require inventing a new all-time-high calendar; it only requires the repair to keep printing acceptance above the broken line.
Scenario B — failed break (re-pressure path). The reclaim fails, price slips back under the short-term line, and the tape starts treating $4,000 again as the battle zone rather than a distant background level. In that path, the social “break” was a probe, not a regime change — and traders re-weight the prior selling structure until a cleaner hold appears. Deeper supports from the earlier summer map only become active if the psychological floor also loses acceptance; they are contingencies, not a forecast.
Scenario A fails quickly if price loses the breakout zone on expanding selling and cannot reclaim it in the next liquid sessions. Scenario B fails quickly if a dip into the reclaimed line (or into $4,000) is bought with follow-through that restores higher lows. In both cases, treat crash-certainty posts as a sentiment gauge — then verify against hold quality, not against the loudest caption.
Gold structure dashboard
| Lens | Observation (mid–late Jul 2026 window) | Trader read |
|---|---|---|
| Short-term trendline | Desk notes: main short-term bearish line breached (Jul 21–22) | Step 1 complete if accepted |
| Hold / retest | Fight near ~$4,100 with EMA50 treated as dynamic support | Step 2 — decides repair vs failed break |
| Session print (example) | LiteFinance window: spot ~$4,125 (Jul 23) | Above the $4,100 battle, not a finished trend |
| Nearby ladder | Supports ~$4,114 / $4,060 / $4,008; resistance ~$4,157+ | Map for digestion, not a signal list |
| Psychological floor | ~$4,000 mid-year pivot language | Floor / magnet — not “crash switch” |
| Higher-timeframe context | March-era daily downtrend still the summer structure story (June desk map) | Short-term break ≠ full trend reversal proof |
| Social binary | “Hold = up / fail = crash” | Use as sentiment; replace with dual paths |
Levels are observation windows from public desk notes and session prints — not live quotes. Live pricing: XAUUSD.
Final thoughts
Gold can break a downtrend line without guaranteeing the next leg higher — and it can fail a hold without proving a market-wide crash. The durable habit is simple: treat the break as a claim, the hold as the evidence, and the $4,000 zone as the deeper structure check that still sits under the short-term noise. Update the map as the tape either accepts the reclaimed line or hands control back to the prior selling regime.