

Retail gold feeds are full of the same Monday setup: buy XAUUSD near 4098/4094 — an order-block pocket after a market-structure shift — while others warn the metal is about to “trap” everyone. The useful map is not “Monday long equals free money” and not “the entire market is doomed.” It is a three-step structure read: tight range → quality of the 4090s demand retest → breakout acceptance or trap.
For live precious-metals pricing while that debate plays out, see the XAUUSD product page. For the related mid-July “break vs hold” structure note, see Gold broke a downtrend — why the hold mattered.
Key takeaways
- 4098/4094 is a demand-zone hypothesis inside the 4080–4100 box — not a finished Monday trade plan.
- Late-July spot near ~$4,090 sits in that compression after a midweek rebound toward the mid-$4,100s.
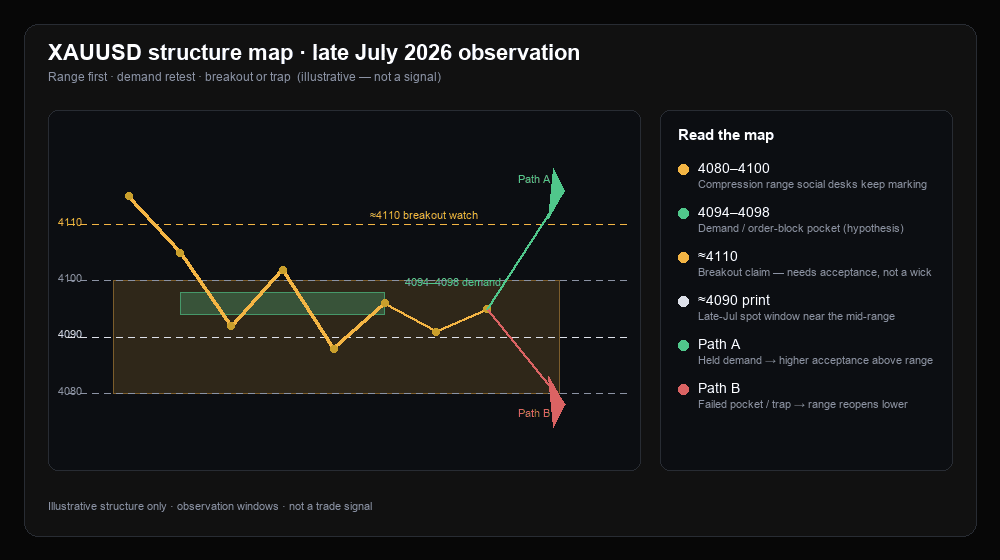
- Watch two paths: held demand and acceptance above ~4110 vs failed pocket and a trap back through the range.
What does the “Monday buy near 4098/4094” claim actually describe?
It describes a retail demand pocket — often labeled an order block after a short-term market-structure shift — not a certified institutional mandate to buy at the open. On social charts, the pin usually sits under a recent impulsive bounce: last opposing candle, break of structure, trendline break, then “buy the retest.” That language is map vocabulary. It is not the same thing as a recommendation to place an order on Monday.
The pin also sits inside a broader late-July compression. Parallel #XAUUSD posts have been marking low-volatility oscillation roughly between 4080 and 4100, with a commonly watched upside claim that a strong break and hold above about 4110 would open a fresher upward leg. That means a 4094–4098 long idea is not “buying the empty sky” — it is proposing to defend demand inside a box that still has not resolved.
The tape is close enough to make the debate live. On Monday, July 27, 2026 in the early New York hours, Kitco’s spot board showed gold near about $4,092–$4,094 with a session low/high near about $4,083–$4,117 and a day change near +1%; Trading Economics’ same-day gold print was in the same ~$4,092 neighborhood. Those are observation windows, not end-of-day settlements — but they put the social buy zone on the active map rather than months away.
Context matters too. According to Reuters coverage on Wednesday, July 22, 2026, spot gold was about $4,145 (+1.7%) around 1:35 p.m. Eastern after a session high near $4,165.87 — its highest print since July 7 in that report — with August US gold futures settling about 1.9% higher near $4,151.90. A “Monday buy near 4090” conversation is therefore happening after a two-week peak attempt, not at the bottom of a straight-line washout. For a same-week cross-asset risk map when oil and Nasdaq futures were the louder story, see Nasdaq futures and oil risk-off.
Why does the 4080–4100 range matter more than the entry pin?
Because a demand pin inside an unresolved box is only half a setup — the box’s resolution decides whether the pin was support or bait. In trader language, buying 4094–4098 without a range rule is like defending a floor while the ceiling and the trapdoor are still untested. The market can respect the pocket and grind higher. It can also run stops through the pocket (the classic “trap”), or fake a squeeze above 4100–4110 and fail back into the range.
That is why the competing social headline — “gold is about to trap the entire market” — is useful as a sentiment gauge and weak as a forecast. A trap, defined tightly, is checkable: either failed demand (price loses the 4090s pocket and acceptance shifts lower toward 4080 and beyond) or a failed breakout (a push through ~4110 that cannot hold and returns into the box). Neither outcome requires mystical “entire market” language. Both require looking at whether the next liquid sessions accept or reject the claimed structure.
Macro still frames the compression. Earlier in July, Reuters reported that soft US inflation prints helped gold rebound (spot near about $4,064 (+1.6%) on the July 14 window, with futures near $4,069.70). The same month, Reuters also covered broker forecast cuts — including HSBC lowering its 2026 average gold view to about $4,560 from $4,864 on a more hawkish Fed tilt, with a rest-of-year trading band described around roughly $3,800–$4,700. That mix — bounce on softer data, still-contested rate path, post–July 22 digestion — is exactly the kind of backdrop where gold often ranges first and resolves later, especially into a Federal Reserve decision week (the July 28–29, 2026 FOMC window). Fed week is an event-risk label on the calendar, not a prediction of the statement.
What should traders watch next?
Watch whether the 4090s pocket absorbs pullbacks — and whether ~4110 becomes acceptance rather than a wick.
Scenario A — demand holds and the range resolves higher. Dips into roughly 4090–4098 are bought rather than sold in a cascade, higher lows form inside or above the prior box, and a break through about 4110 is followed by acceptance (holds on retests) instead of an immediate dump back into 4080–4100. In that path, the social order-block story becomes more than a screenshot: the market is treating the mid-range demand as a floor while the upside claim above 4110 starts to earn follow-through. This path does not require inventing a return to January extremes on a timer; it only requires the range to resolve with demand still in control.
Scenario B — trap / failed demand. Price tags the 4094–4098 area, briefly looks supportive, then loses the pocket with expanding selling and starts treating 4080 as the next acceptance test rather than noise. Alternatively, a spike through 4100–4110 fails quickly and dumps back through the demand zone — the two-sided trap social posts shout about, but now stated as structure rather than prophecy. In that path, “Monday buy” was a liquidity event inside a still-broken range, and attention shifts back to defending deeper mid-year floors rather than chasing the first breakout headline.
Scenario A fails quickly if a push above ~4110 is sold hard and the 4090s pocket cannot reclaim on the next liquid sessions. Scenario B fails quickly if a stop-run under 4090 is bought aggressively and price reclaims the mid-range with higher lows into and through 4110. In both cases, treat “trap the entire market” captions as volume for attention — then verify against acceptance, not against the loudest warning emoji.
Gold range dashboard
| Lens | Observation (late Jul 2026 window) | Trader read |
|---|---|---|
| Social buy pin | ~4098 / 4094 demand / order-block language | Hypothesis inside the box — not a signal |
| Compression range | Retail map ~4080–4100 low-vol oscillation | Unresolved structure that owns the entry debate |
| Upside claim | Break / hold above ~4110 often cited next | Acceptance > first wick |
| Spot print (example) | Kitco / TE window Jul 27: ~$4,092; session ~$4,083–$4,117 | Zone is live tape, still mid-range |
| Prior rebound context | Reuters Jul 22: spot ~$4,145; high ~$4,166; futures ~$4,152 | Monday debate = digestion after two-week peak attempt |
| Macro backdrop | Soft-inflation bounce mid-month; hawkish-tilt forecast cuts; FOMC Jul 28–29 week | Why gold can compress before it chooses a side |
| Trap definition | Failed demand under 4090s or failed breakout above ~4110 | Checkable paths — not “entire market” certainty |
Levels are observation windows from public quotes and social structure maps — not live quotes or trade instructions. Live pricing: XAUUSD.
Final thoughts
A Monday buy pin near 4090 can be a clean demand story or the first half of a trap — the range decides which. The durable habit is simple: treat 4094–4098 as a hypothesis inside 4080–4100, treat ~4110 as a claim that needs acceptance, and update the map as the tape either defends the pocket or hands control back to sellers under the box. Structure first; captions second.