


Gold's $4,650 breakout test is not a clean buy-or-sell switch. XAUUSD has traded above the level, pulled back toward $4,600 and returned to test the area again. The useful question is whether price can gain acceptance above $4,650—or whether repeated rejection turns the move into a bull trap.
That answer requires more than one candle. Traders need to compare the close, the next pullback, the US dollar and Treasury yields. Crypto traders should also watch whether Bitcoin joins the move because of a softer-dollar theme or diverges as gold attracts defensive demand.
Key takeaways
- A brief print above $4,650 is a test; sustained closes and a successful retest show acceptance.
- A return below $4,600 followed by a failed reclaim would strengthen the false-break case.
- The dollar and yields help reveal whether gold's move is macro-backed or momentum-only.
Is gold breaking above $4,650 today?
Gold has tested the zone, but the latest venue-specific prints do not yet show lasting acceptance. Vantage's TradingView setup placed XAUUSD at $4,646.33 at 06:19 GMT+8 on 24 August 2026, after a latest-print high of $4,654.72. By approximately 13:50 Asia/Taipei on 27 August, the verified MC Markets XAUUSD page showed mark and oracle prices near $4,607.58, with a 24-hour move around -$31.44 (-0.67%).
Those observations are not contradictory. They come from different times and venue-specific feeds, and they show why “gold broke $4,650” needs a timestamp. The market can trade through a level without converting it into support. A breakout becomes more meaningful only when price spends time above it and absorbs selling on the next retest.
Why does the $4,650 area matter?
$4,650 matters because it has repeatedly acted as both support and resistance, not merely because it is a round number. FOREX.com's 24 August analysis described several probes above the level that failed to extend during Asian trade. FXEmpire's 25 August review similarly treated $4,630–$4,650 as a zone where gold needed to settle before the move could continue.
The underlying trend was still constructive before the latest pullback. Vantage's 24 August setup put the 50-period average at $4,627.80 and the 200-period average at $4,556.70, with price above both and RSI near a neutral 55.9. That is a healthier starting point than an extremely stretched oscillator, but moving averages describe prior structure; they do not guarantee the next break.
A related MC Markets analysis on gold above $4,400 made the same distinction at an earlier stage of the rally: crossing resistance is the first signal, while closes and retests decide whether the market accepts the new range.
What would confirm a real breakout?
The cleanest confirmation would be a close above $4,650 followed by a pullback that holds the zone or reclaims it quickly. A high-volume session can add weight, but time above the level matters more than a brief spike. Repeated higher lows below resistance also show that sellers are losing control; repeated long upper wicks show the opposite.
The macro backdrop should confirm the price action. A stable or softer US dollar reduces a major headwind for dollar-priced gold. Stable or falling Treasury yields lower the opportunity cost of holding a non-yielding asset. If price clears $4,650 while the dollar and yields rise sharply, the breakout has less cross-market support and deserves more caution.
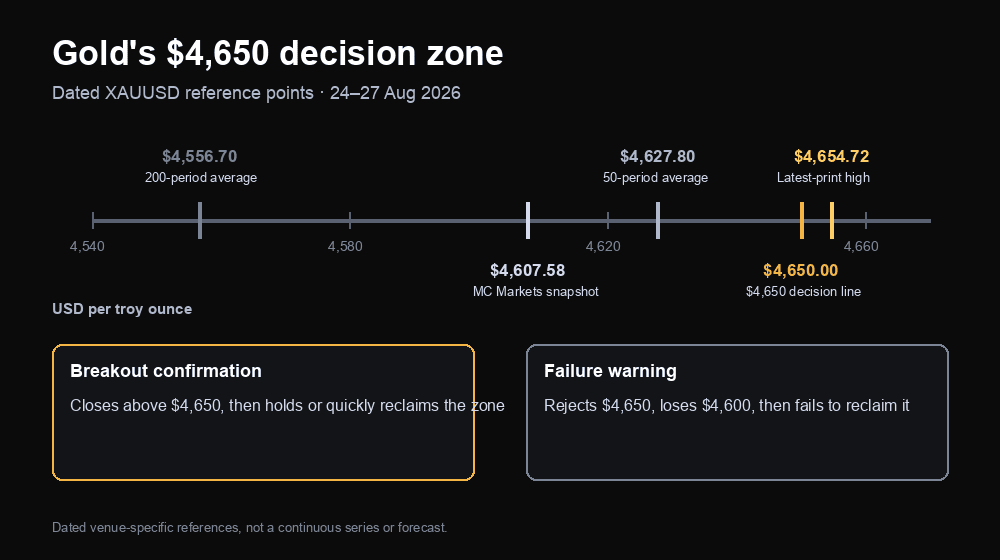
Dated Vantage and MC Markets references, not a continuous price series. XAUUSD prices vary by venue and can change quickly.
What would signal a failed breakout?
A fast rejection below $4,650 is an early warning; losing $4,600 and then failing to reclaim it would make the warning stronger. Economies.com's 27 August analysis treated stability around $4,600 as the base for the latest recovery. FXEmpire also used a move back below $4,600 as the point where downside momentum could reappear.
The sequence matters. One dip below $4,600 can be a liquidity sweep or a venue-specific print. A close below the area, a weak bounce, and another rejection beneath $4,650 would show that former resistance remains in control. That is more informative than declaring a “crash” from a single red candle.
The earlier gold downtrend-break analysis explains the same market principle: holding a broken level usually carries more information than the initial break itself.
Which signals separate acceptance from rejection?
| Signal | Acceptance above $4,650 | Rejection / failed break |
|---|---|---|
| Closing price | Repeated closes above the zone | Close back below after an intraday probe |
| Retest | Holds $4,650 or reclaims it quickly | Loses $4,600 and cannot regain $4,650 |
| US dollar | Soft or stable | Broad rebound adds pressure |
| Treasury yields | Stable or easing | Sharp rise raises opportunity cost |
| Momentum | Higher lows without an extreme oscillator | Repeated upper wicks and weaker rebounds |
| Cross-assets | Silver and copper participate without stress signals | Gold rises alone while risk assets and liquidity weaken |
How do the dollar and yields change the setup?
The dollar is the fastest cross-check because gold's latest advance has been unusually sensitive to it. FOREX.com's five-day study on 24 August found gold's correlation with the Dollar Index near -0.84, stronger in magnitude than its relationship with nominal or real Treasury yields over that short window. Correlations change, but the reading explains why a DXY rebound could challenge the breakout even if gold's chart still looks constructive.
Yields remain important because they change the cost of holding an asset that pays no income. The combination matters: a softer dollar and lower yields gives gold two supports; a stronger dollar and higher yields creates two headwinds. Mixed signals usually produce the whipsaw conditions that make an intraday $4,650 print less reliable.
What does the gold test mean for Bitcoin traders?
Gold and Bitcoin can move together under a currency-debasement or liquidity narrative, but the relationship is not stable enough to trade as a fixed pair. FOREX.com's same five-day window put gold's correlation with Bitcoin near +0.63. That was meaningful but weaker than gold's links with silver at +0.93 and copper at +0.90.
If gold clears $4,650 while the dollar weakens and Bitcoin also strengthens, the common driver may be easier financial conditions or demand for alternatives to cash. If gold rises while Bitcoin and equities fall, the move is more likely defensive. For global-asset traders, the cross-market pattern often reveals more than the gold candle alone.
Final thoughts
$4,650 is a decision zone, not a prediction. The constructive case needs closes above it, a controlled retest and support from the dollar-yield backdrop. The failed-break case begins with rejection, becomes clearer below $4,600 and is confirmed only if buyers cannot reclaim the zone. Let acceptance—or its absence—answer the breakout question.