


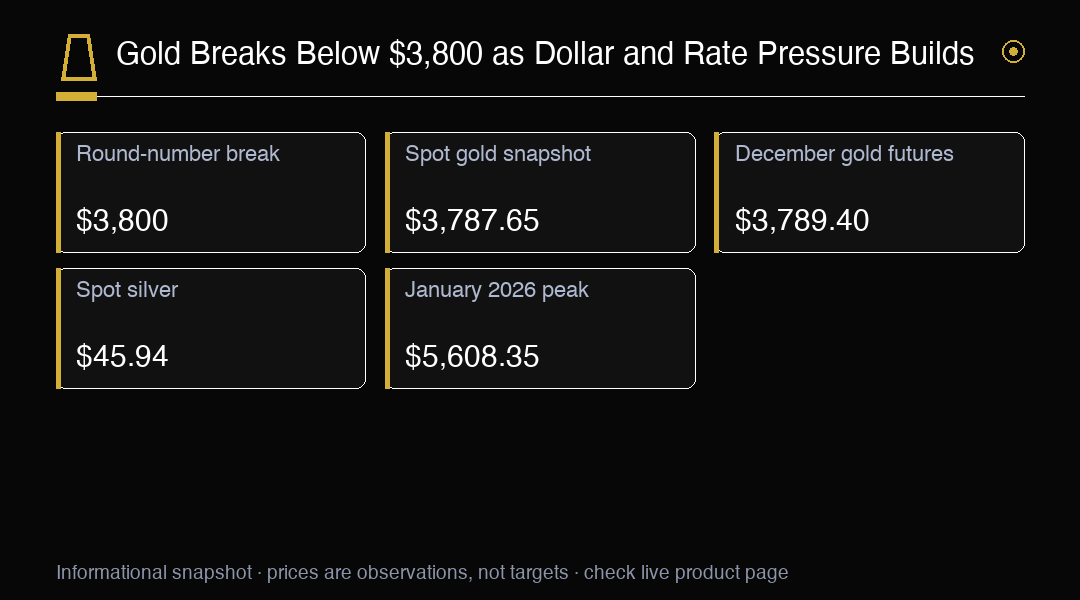
Gold fell through $3,800 on November 18, extending a retreat that has carried bullion to its lowest level since September 2025. Spot gold was down 1.6% at $3,787.65 an ounce at 04:28 GMT. December US gold futures fell 1.9% to $3,789.40, while spot silver lost 3.1% to $45.94 an ounce. The break came after gold had reached a record high earlier this year, so the immediate move sits within a much larger reversal. For traders, the round-number breach brings price behavior around $3,800 into focus as currency and rate pressures converge.
The US dollar traded near a 19-month high during the session, giving gold another headwind. Bullion is priced in dollars, so a stronger greenback raises the cost for buyers using other currencies. That can temper overseas demand, particularly when the dollar’s advance is broad and persistent. The relationship is not mechanical: local prices, physical demand, investment flows and risk appetite also matter. Still, dollar strength helps explain why gold can struggle even when investors remain attentive to inflation or geopolitical risk. A firm currency can also signal confidence in US assets, drawing capital toward dollar-based investments and away from non-yielding bullion.
Treasury yields and expectations for Federal Reserve policy help connect the dollar with gold’s decline. When yields rise, interest-bearing assets can offer investors a more attractive return than bullion, which pays no coupon. Higher yields also increase the opportunity cost of holding gold: investors give up potential income while keeping exposure to an asset whose return depends on price appreciation. Changes in expected policy can move yields before the Fed announces a decision, as markets reassess the likely path of borrowing costs. If rate expectations firm, the dollar may gain support and gold may face pressure through both channels, though neither relationship guarantees the next price move.
CME FedWatch pricing showed a 95.7% probability of a 25-basis-point increase at the December meeting and a 4.3% probability of a 50-basis-point move. Those probabilities captured market expectations at the time, not a completed policy decision. The distinction matters because traders continuously adjust their estimates as inflation, employment and activity data arrive. A change in rate pricing can quickly feed into Treasury yields, currency markets and gold valuations. The figures also show that a quarter-point increase was overwhelmingly the market’s base case, while a larger move remained a smaller possibility. Their significance lies in how expectations may shift, not in certainty about the meeting outcome.
Federal Reserve meeting minutes were due on November 18, giving markets a timely window into policymakers’ discussion of inflation, growth and risks. The minutes can clarify how officials viewed the balance between price stability and economic activity, and whether their debate leaned toward maintaining restrictive policy or moving toward easing. Investors will compare that account with the rate path already reflected in yields and CME FedWatch pricing. If the discussion appears more concerned about persistent inflation, expectations for higher rates could strengthen. If officials show greater concern about slowing activity, the market may reassess how long policy needs to remain tight. The minutes add context; they do not settle future decisions.
The decline from gold’s January 2026 all-time high of $5,608.35 is substantial. At $3,787.65, spot bullion stood approximately 32.5% below that peak, a drawdown that reflects a major loss of momentum from the record-setting advance. A drawdown measures how far an asset has fallen from a previous high; it helps frame the scale of the retreat without identifying a bottom. The comparison also highlights why traders may treat current weakness differently from an ordinary daily fluctuation. Some investors may view the decline as a reset after an extended rise, while others may wait for evidence that selling has eased before rebuilding exposure.
December gold futures fell more sharply than spot in the cited session, declining 1.9% against spot’s 1.6% loss. The two prices represent different instruments. Spot gold reflects near-term settlement, while a futures contract sets terms for delivery at a specified future date. Their prices can diverge because of financing costs, storage, contract timing and market positioning. A single session’s gap does not by itself establish a lasting change in the relationship, but it shows that selling pressure reached both markets. Traders comparing the two should keep contract dates and quote times in view, particularly around fast moves when liquidity and positioning can affect short-term pricing.
Silver’s 3.1% drop to $45.94 an ounce showed that weakness extended across precious metals during the session, with silver falling more steeply than gold. The metals can share drivers such as the dollar and interest-rate expectations, but their demand profiles differ. Gold is often closely watched as a store of value and portfolio hedge, while silver also has significant industrial uses. That mix can produce sharper swings when investors reassess growth alongside monetary policy. Silver’s decline adds evidence of broad pressure across the complex at that moment, while its greater sensitivity to industrial demand can create a distinct path if the economic outlook or sector-specific buying changes.
The $3,800 threshold is now a clear near-term reference for gold. Trading below it places the burden on buyers to show that demand can absorb selling and reclaim the level. A sustained return above $3,800 would put the break in question and could encourage traders to reassess the immediate downside momentum. Continued trading beneath the threshold would keep attention on whether losses extend and whether selling accelerates around nearby prices. Round numbers often attract orders because they are easy to monitor, so brief moves across the level may occur without changing the broader picture. Follow-through across subsequent sessions will matter more than a momentary touch.
The next leg depends partly on whether the dollar, Treasury yields and policy expectations continue to reinforce one another. A firmer dollar alongside rising yields would preserve two pressures on bullion: weaker purchasing power for non-dollar buyers and a higher relative return available from interest-bearing assets. A softer dollar or retreating yields could ease those pressures and allow other sources of demand to carry more influence. The Federal Reserve minutes may alter that balance if they change the market’s reading of the December outlook. Yet the response can be uneven: traders may have already priced much of the message, or focus instead on incoming economic data and positioning.
For traders following XAUUSD, the market map is defined by the $3,800 threshold, the $3,787.65 spot reading at 04:28 GMT and the wider drawdown from January’s $5,608.35 peak. December futures at $3,789.40 and silver at $45.94 offer additional context for how weakness spread across precious metals. The CME FedWatch probabilities and the November 18 minutes keep December policy expectations in view, while the dollar and yields remain key channels to monitor. Price action around $3,800 can show whether buyers are beginning to defend the level or sellers retain control. The balance can change as new information arrives.
Trading Insight
Gold’s break below $3,800 leaves the round number as a near-term reference, with dollar strength and December rate pricing shaping the backdrop. Watch how prices respond around the reported spot level as markets assess the Fed minutes.