


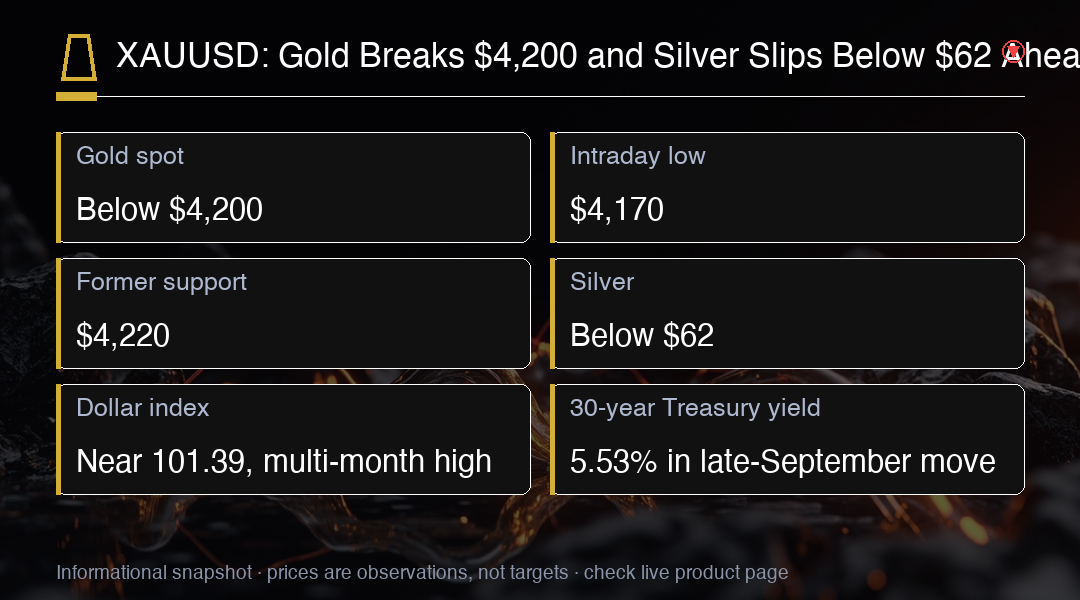
Gold XAUUSD dropped below $4,200 on Thursday, extending a decline that had already taken the metal down more than 1.5% during Asian trading. The weakness came in the part of the session where the largest physical market is active, which tends to make early moves less informative than the New York close. By the time US trading is complete, the market has usually settled on a level that either holds or clearly does not. The distinction between an intraday dip and a session close matters more here than usual, because the monthly loss depends on where the final print lands.
The break toward $4,170 per ounce adds technical pressure after bullion failed to stabilize around $4,220 and puts it on course for a monthly decline exceeding 4% and a low last seen in early August. A retest of a level from earlier in the same month is a different kind of event from a first visit: the buyers who defended it the first time are now being asked to defend it again with more information about the trend. A month-end level also carries reference value for positioning, since funds tend to rebalance around calendar boundaries.
Silver fell below $62 an ounce, amplifying gold's move. Silver typically behaves like a higher-volatility version of gold, but its industrial exposure also makes it sensitive to weaker Asian equities and concerns that higher borrowing costs will eventually slow manufacturing demand. That dual character cuts both ways: when the driver is monetary, silver follows gold; when the driver is growth, the industrial leg tends to pull it lower on its own. That asymmetry explains why silver can sell off faster than gold even when the driver is purely monetary.
The broader precious-metals complex is under pressure. Platinum and palladium both fell, suggesting the move is not limited to profit-taking in gold. Investors are reducing exposure across metals as the dollar and bond yields become more attractive alternatives. A move that reaches the whole complex points to a common cause rather than to a problem in any one metal, which is why the cross-asset correlation matters more here than any single level. Checking whether the whole complex is moving is a quick way to separate a metal-specific story from a macro one.
The dollar index climbed to a multi-month high near 101.39, while the 30-year Treasury yield was reported near 5.53% in the late-September market move. A stronger dollar makes metals more expensive outside the US, while higher yields increase the opportunity cost of owning assets that pay no interest. Both effects work through the same channel: they raise the bar a non-yielding asset has to clear before capital is willing to hold it. Gold is the clearest expression of that comparison, which is why the dollar index tends to lead the metal in both directions.
Traders now project roughly a 64% to 70% probability range for another Fed increase in October, with one account putting the figure near 70.3%. Markets are also pricing about 25 basis points of additional tightening through late 2027, a significant shift away from the rate-cut expectations that previously helped support gold. A pricing structure that extends that far beyond the next meeting tends to anchor positioning around it, because most participants hold positions on a horizon longer than a single print. The October meeting is the near-term anchor, while the longer-dated pricing shapes the incentive to hold rather than trade.
Gold's break below $4,200 turns the former support into the first resistance level. A quick recovery and close back above it would suggest the latest move was partly driven by stops and thin liquidity. Continued trading below it could expose $4,150, followed by the psychological $4,100 area. Stops tend to cluster just under obvious levels, which is why a break of a round number often travels further than the preceding range would suggest. Round numbers attract more resting orders than irregular ones, which is part of why the move after a break tends to overshoot.
Silver faces a similar test at $62. A recovery above that level would help stabilize the wider metals complex, while continued weakness would bring $60 into view. Because silver tends to move more aggressively than gold, its reaction may provide an early indication of whether selling pressure is beginning to exhaust itself. Reading silver first is a reasonable shortcut when the two metals are being driven by the same macro impulse. That makes the sequence useful: silver stabilising before gold would suggest the selling pressure was largely exhausted.
The economic calendar for the coming week is busy. ISM manufacturing data arrives Thursday, October 1, followed by nonfarm payrolls on Friday, October 2. Economists expect 100,000 new jobs and unemployment near 4.1%. PCE inflation is not scheduled until October 14, not the following Wednesday as initially stated. For a rate-sensitive metal, the two prints inside the same week carry more weight than a single inflation reading would, because they arrive close enough to move the same rate path. Two data points inside a week also mean the market gets two chances to test the same thesis before the next scheduled inflation reading.
Softer inflation or employment data could pull yields and the dollar lower, giving gold an opportunity to reclaim $4,200. Hot PCE inflation or unexpectedly strong payrolls would strengthen the higher-for-longer argument and leave both gold and silver vulnerable to another leg down. The asymmetry sits in the reaction function: metals tend to respond faster to a hawkish repricing than to a dovish one, because the dovish case is usually already partly priced. Positioning built around a hold can be unwound quickly, which is how a single employment print produces a large move in a market that looks technically calm beforehand.
The gold, silver and 30-year-yield levels are broadly plausible with timestamps. The key corrections are the 90 basis points of additional tightening through 2027, which should be roughly 25 basis points, and the 85,000 payroll estimate, which should be closer to 100,000 based on contemporaneous consensus. Neither error changes the direction of the move, but both change the size of the repricing that has already been priced into the metal. Recording the correct figure matters because a metal priced against an overstated tightening path looks cheaper than it is.
For traders, the setup is a test of the $4,200 breakdown. A recovery above that level would suggest the move was overdone, while continued weakness would expose $4,150 and $4,100. The macro backdrop is the key variable: a dovish shift in Fed expectations would be bullish for gold, while a hawkish repricing would pressure the entire metals complex. Treating the level and the macro backdrop as one signal rather than two keeps the position internally consistent. A level plan that assumes the macro backdrop is unchanged is the kind that fails quietly when the backdrop is not.
Trading Insight
Watch the $4,200 level rather than the day-to-day noise. It was former support, so a break below it is technically significant. The macro backdrop matters more than the chart: a 64% to 70% hike probability range is a headwind, but a shift toward a hold would be a tailwind. Size for volatility around the ISM and payrolls prints.