


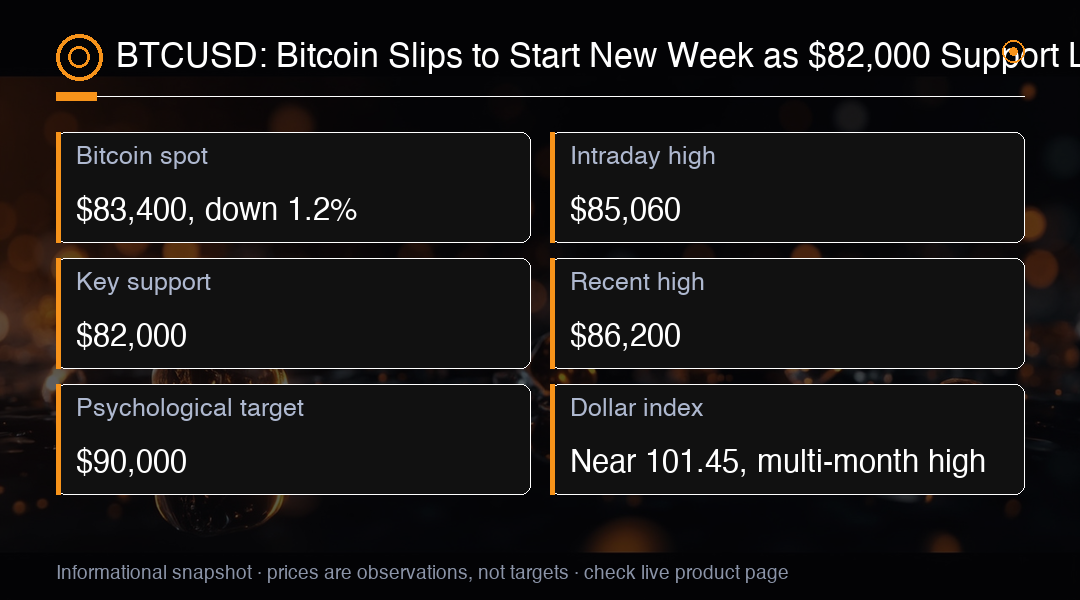
Bitcoin BTCUSD fell 1.2% to $83,400 on Thursday after trading as high as $85,060 earlier in the session. The retreat follows last week's rally above $86,000, which gave the cryptocurrency its highest price since January. A single down day after an advance that size is not in itself a change of trend, but it does show that buyers are no longer willing to push higher into that area. The distance between the $85,060 session high and the $83,400 close illustrates how quickly the market gives back ground once momentum stalls, and it is the pace of that giveback rather than the single session that tends to set the tone for the days after.
The recent advance was substantial: Bitcoin climbed more than 30% from its August 19 level and briefly approached positive territory for 2026. Strong spot-ETF inflows, improving regulatory sentiment and the closing of bearish positions all contributed to the move. A gain of that scale compresses a long consolidation into a short stretch of price action, which means the structure underneath is far less tested than the headline move suggests. It also means the cost basis of most recent buyers now sits well above the level where the advance began, which changes how quickly the market can be made to defend itself if the flow that drove it pauses.
Crypto-linked stocks followed Bitcoin higher last week. Coinbase and Robinhood gained more than 4% during the breakout session, while Strategy continued adding to its Bitcoin holdings. Those shares now provide another gauge of whether institutional appetite survives the latest macro twist. Because the equities respond to the same flow expectations without the continuous trading schedule of the underlying asset, they can hold their gains or give them back at different hours, which makes them a useful cross-check when the weekend price action is still fresh. Divergence between the two is often the first place a change in the flow shows up.
The important technical level is $82,000. Bitcoin was rejected around that area in mid-May and again in early September, making the eventual breakout notable. A level that has turned buyers away twice carries a memory built into the order book, and the supply that defended it before tends to be reconsidered rather than replaced. The wider band between those two rejections is the zone where the current advance either found a floor that holds or stalled, so $82,000 now carries more weight than a level tested only once. That is what makes the next visit to it a genuine test of the structure rather than a routine pullback.
Holding $82,000 would leave the recent move intact and provide another route toward $85,000 to $86,000. A convincing close above the recent $86,200 high could then bring the psychological $90,000 level into view. The sequence matters more than any single print: a defended level followed by a close back through the previous high confirms that the buyers who were capped earlier have been absorbed. Until both steps are in place, the move reads as a recovery inside a range rather than a completed breakout, and the distinction governs how much weight each subsequent session carries.
A break back below $82,000 would weaken the breakout and expose $80,000, followed by the broader $78,000 area. Because the same level would then be tested for a third time, the response around it would carry less information than the first two attempts. Below $82,000, the recent 30% advance gives back a meaningful part of its ground quickly, and traders would be looking for evidence of where the market actually found demand during the earlier rejections rather than for any single round number. Round levels tend to attract resting orders, which can produce fast moves through them on relatively little volume.
Bitcoin's latest weakness is occurring alongside falling equity futures and retreating precious metals. That combination usually points to a broad reduction in risk appetite rather than to a problem specific to the cryptocurrency, and it matters for how the $82,000 test resolves. Moves driven by a shared macro factor tend to persist until the factor changes, whereas moves driven by asset-specific supply tend to fade on their own. The cross-asset confirmation is therefore a stronger argument for patience than any single candle on the Bitcoin chart, and it raises the odds that the coming data releases matter more to this level than the recent price action did.
The dollar index has reached a multi-month high near 101.45, while the 30-year Treasury yield reached 5.652% intraday on September 30. Markets now assign a 37.1% probability to another Fed increase in October, with a 62.9% chance of a hold. Higher yields make cash and government debt more competitive with Bitcoin and other assets that generate no income. The long end of the curve is the part that matters most here, because it sets the hurdle rate that non-yielding assets have to clear before capital is willing to stay with them, and it is the level that has been moving rather than the policy rate itself.
The economic calendar for the coming week is lighter than the article's original framing suggested. ISM manufacturing data arrives Thursday, October 1, followed by nonfarm payrolls on Friday, October 2. PCE inflation is not scheduled until October 29, not the following Wednesday as initially stated. With the inflation print that far out, the data arriving first are activity and labour figures, which reach the market through the growth and employment expectations that feed into the rate path rather than through the price statistics directly. That sequencing leaves the rate question open across both releases instead of being settled by the first one.
Softer inflation or employment data could pull yields and the dollar lower, helping Bitcoin defend $82,000. Hot inflation or strong employment figures would reinforce rate-hike expectations and increase the risk of a deeper retracement. The transmission runs through the discount rate: a lower dollar and lower long-end yield reduce the opportunity cost of holding a non-yielding position, while a hawkish repricing raises it. Because the 30-year yield has been the level making headlines, a move there would be the clearest signal in either direction. The payrolls release on Friday sits at the end of the week and is the point at which those expectations are most likely to be settled.
The price levels in the story are broadly plausible for October 1, 2026, but the macro and calendar framing needed correction. The 30-year yield was understated at 5.52% when the intraday high was 5.652%, and the October hike probability was stale at 66% when FedWatch put it at 37.1%. Both corrections change the picture a reader would form. A 5.52% yield reads as a firm but orderly rate environment, while 5.652% describes a market under visible strain, and a 66% hike probability would imply far less uncertainty than the 37.1% currently priced. The corrected figures matter because they shift where the burden of proof sits.
For traders, the setup is a test of the $82,000 breakout. A hold above that level keeps the path toward $86,200 and $90,000 intact, while a break below would expose $80,000 and $78,000. The macro backdrop is the key variable: a dovish shift in Fed expectations would be bullish for Bitcoin, while a hawkish repricing would pressure all risk assets. The neutral reading of the data available now is a hold, so the burden of proof sits on the bulls, and the level that decides it is the one that has already been rejected twice. Until one of those two paths is confirmed, the range remains the more accurate description of the market.
Trading Insight
Watch the $82,000 level rather than the day-to-day noise. It has been rejected twice before, so a hold above it confirms the breakout is real. The macro backdrop matters more than the chart: a 37.1% hike probability is a headwind, but a shift toward a hold would be a tailwind. Size for volatility around the ISM and payrolls prints.