


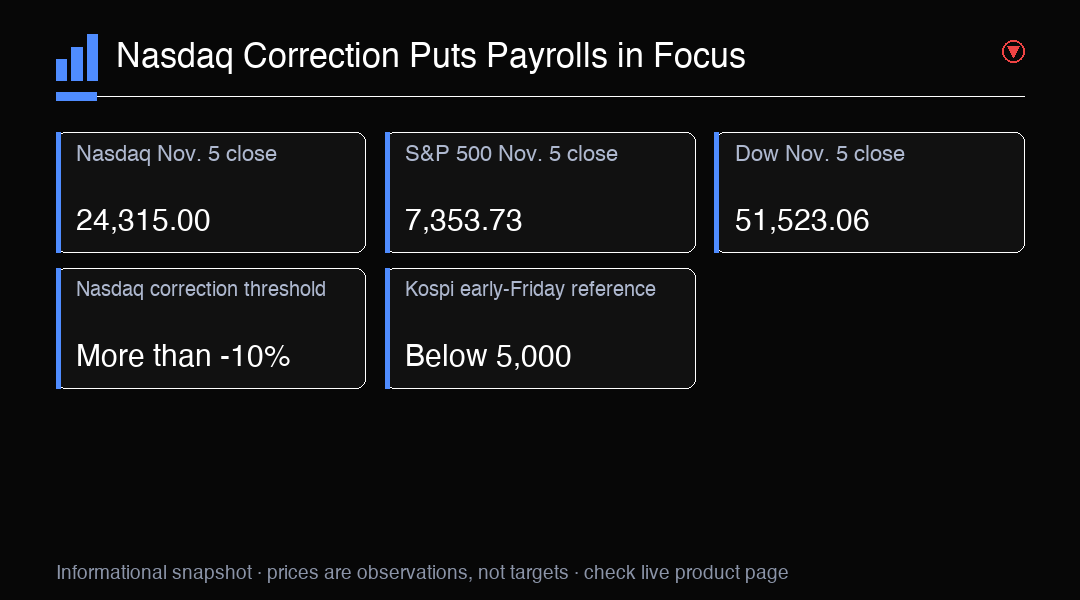
Thursday’s selloff changed the tone of the market in a single session. The Nasdaq Composite closed at 24,315.00, down 5.52%, its worst session since April 2025 and a move that placed the index in correction territory. A correction means a decline of more than 10% from a recent closing high. The S&P 500 finished at 7,353.73, down 4.36%, while the Dow closed at 51,523.06, a loss of 1,833.06 points, or 3.44%. These regular-session closes provide a clearer measure of Thursday’s damage than overnight futures, which describe a separate and still-changing trading window.
The scale of the decline matters, but so does its concentration. Nvidia fell 9.26% to $181.60, while AMD and Micron each lost about 17%. The Nasdaq’s larger drop than the S&P 500 and Dow points to particular pressure on technology and semiconductor exposure. A sharp fall in a group of large, widely held companies can weigh heavily on a capitalization-weighted index, even when other parts of the market perform differently. Thursday’s figures show what happened during that session; they do not establish that every technology company faces the same outlook or that the same pace of selling will continue.
One way to understand the move is as a rapid repricing of risk in businesses whose valuations depend on expectations for future growth. Investors weighing the scale and timing of spending on artificial intelligence, the ability to convert that spending into earnings, and the prices already assigned to related companies may become less willing to tolerate uncertainty. That is a framework for interpreting the sensitivity of technology shares, not proof of a single cause for Thursday’s losses. The observed share declines alone cannot tell us how much reflected changing earnings expectations, portfolio adjustments, reduced risk-taking, or trading flows.
The reported estimate of roughly $2.9 trillion in US equity market value erased during the session conveys the breadth of the shock, but it is an aggregate estimate rather than cash withdrawn from every investor’s account. Market capitalization changes when share prices change, and the calculation depends on which securities and time window are included. That distinction helps keep a large headline number in perspective. It describes the estimated change in the value of listed equities; it does not independently measure household losses, the size of new selling, or the likely path of prices in the next session.
Early Friday trading in Asia showed that the stress had not stayed within US technology shares. South Korea’s Kospi fell more than 8%, moved below 5,000, and triggered a 20-minute trading halt. Japan’s Nikkei 225 fell 5.9%. These are early-Friday market references, not Friday closing results. The moves show how a sharp decline in globally connected technology shares can coincide with pressure in markets that have significant exposure to chipmakers and related businesses. They do not mean that every Asian market or company moved in the same way.
US equity futures offered a mixed early-Friday snapshot after the previous session’s losses. S&P 500 futures were little changed, Nasdaq-100 futures were up 1%, and Dow futures were down 467 points, or 0.91%. Futures are contracts that trade outside the regular cash-market session; their levels can change as orders, news, and liquidity shift. They are not a promise about where the corresponding indexes will open or close. The contrast between a modest rise in Nasdaq-100 futures and a decline in Dow futures suggests different near-term pricing across index exposures, but it is only a snapshot of positioning at that point in the overnight session.
Friday’s US payrolls report is a key scheduled test because employment data can change expectations about economic momentum and Federal Reserve policy. The consensus was for 59,000 new jobs, with unemployment expected at 4.2%. The headline count is only one part of the release. Revisions to earlier months, the unemployment rate, and the relationship between hiring and labor-force participation can change how investors interpret the same headline result. A single report can also be noisy, so the number should be read alongside recent data and subsequent revisions rather than treated as a complete account of labor-market conditions.
Rate expectations add another layer of sensitivity. CME FedWatch pricing put the probability of a 25 basis point Federal Reserve hike at the December 9 meeting at about 70%. That is a market-implied probability, not a policy decision or a guarantee that a hike will occur. Pricing can shift as economic evidence and investor positioning change. Payrolls stronger than expected could prompt some traders to reassess the risk of tighter policy, while a weaker reading could alter expectations in the other direction. Neither outcome mechanically determines equity performance: growth prospects, earnings expectations, valuations, and the details of the report also matter.
Several broad scenarios are possible after the data, without any one being assured. A report near consensus could leave investors focused on the existing policy pricing and on whether Thursday’s losses stabilize during regular trading. A stronger report could renew attention on the possibility of tighter policy, while a weaker one could raise questions about economic momentum even if it reduced some rate pressure. Revisions or a mismatch between payroll growth and unemployment could complicate either reading. The useful task is to compare the full release with expectations and prior data, then observe how markets respond, rather than assign a directional conclusion from one headline figure.
Risk management is especially important when cash markets and futures are moving in separate sessions and large daily price changes can widen uncertainty. Investors can monitor position size, concentration in closely related technology holdings, and the amount of loss they can tolerate if volatility persists. A plan can also identify which new information would change an investment view and which moves are ordinary fluctuations within that plan. These are general process considerations, not personalized instructions. A market rebound in futures would not erase Thursday’s regular-session losses, and another volatile session would not by itself settle the longer-term earnings outlook.
For the next session, the central questions are whether payrolls alter the market’s view of the December policy path, whether selling pressure remains concentrated in technology and semiconductor shares, and whether the Asian declines are followed by further volatility in regular trading. Track reported closes separately from futures indications, and distinguish confirmed results from early references. The NAS100 instrument can serve as a market proxy for Nasdaq-100 exposure, but it is not a direct route to any individual company and does not replicate the Nasdaq Composite exactly. Conditions remain sensitive to incoming data, so no single indicator should be treated as a forecast.
Trading Insight
The selloff was unusually concentrated in technology and semiconductor shares, while early Friday futures were mixed. Payrolls may shift rate expectations, but the report and subsequent market response will need to be assessed together; futures are not regular-session outcomes.