


Figma delivered fast growth and raised its outlook, yet its shares declined in after-hours trading on Wednesday. That reaction highlights a question facing software companies investing heavily in artificial intelligence: can rising adoption turn into durable earnings without making the service too expensive to provide? Figma's third-quarter results offer evidence on both sides. Revenue accelerated, customer spending remained strong, and management reported growing use of its AI features. At the same time, the company reported an 82% non-GAAP gross margin, while expanding AI capabilities requires computing capacity and continued product investment. Traders weighing the results need to separate confirmed figures from unanswered questions about how those costs will develop.
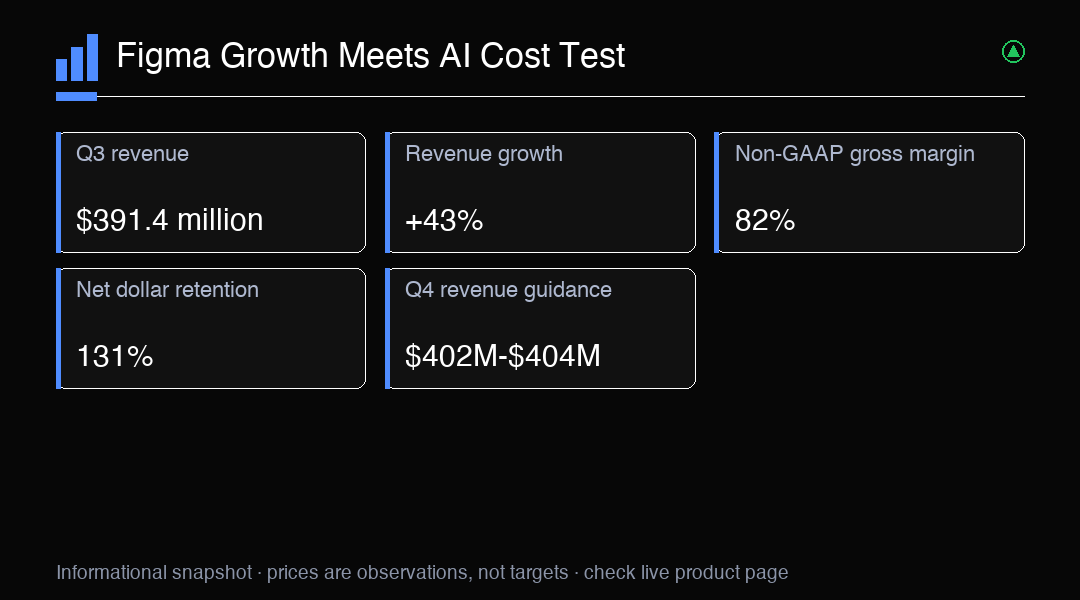
Q3 revenue reached $391.4 million, up 43% year over year and $16.4 million above the high end of Figma's prior guidance. That is substantial growth for a company already serving large organizations, and it indicates that demand extended beyond early experimentation. Revenue, however, does not show how much incremental cost was required to deliver the growth. The useful next question is whether customers continue expanding their use of Figma products while the company serves them efficiently. Investors can compare future revenue growth with gross margin, operating income, and cash generation. A strong sales number is more durable when those measures develop alongside it, though any single quarter provides only a partial view.
Earnings figures also need careful separation. Non-GAAP diluted earnings per share were $0.10, above the $0.05 consensus estimate. GAAP loss per share was $0.15, and Figma recorded a GAAP net loss of $81.348 million. Non-GAAP operating income was $47.0 million. These measures answer different questions: adjusted earnings help show performance under the company's chosen exclusions, while GAAP results include costs that remain part of its reported financial picture. Neither measure alone settles whether the business model is strengthening. Traders should follow the reconciliation and trend across reporting periods, and avoid treating an adjusted beat as proof that all costs associated with growth have been absorbed.
Non-GAAP gross margin was 82%, compared with GAAP gross margin of 80%. Those figures show that the company retained a substantial share of revenue after the costs included in each calculation, but they do not establish where margins are heading. The margin figures also should not be compared with an unverified prior-quarter estimate. For a software platform adding AI features, hosting, inference, and product development can affect costs differently as usage grows. More customer activity may support higher revenue and strengthen the product's value, while heavier use may also increase the infrastructure needed to serve each account. Future margin disclosures can help show which effect is gaining ground.
Figma reported $41.5 million in Q3 free cash flow, equal to about a 10.6% margin. This gives investors another view of the business beyond earnings measures, since cash flow reflects the timing of cash receipts and payments as well as operating performance. One quarter's result should not be projected forward mechanically. Working capital, investment timing, and other cash movements can shift from period to period. Still, cash generation matters when a company is investing in AI: internally funded investment can give management flexibility, while weakening cash conversion over several quarters could make growth more expensive to sustain. Traders can monitor free cash flow beside revenue and margins rather than reading it in isolation.
Customer adoption offers a possible route to monetization, but usage is not the same as paid revenue. By the end of October, 65% of customers with more than $10,000 in annual recurring revenue used Figma's agent weekly, and more than 80% consumed AI credits. Management also said the share of work handled by its own model more than doubled from July through October. Broader use of a company-built model could help control service costs, though the reported usage figures do not quantify savings or establish future profitability. Investors can watch whether AI activity leads to higher customer spending, stronger retention, or greater workflow dependence, while checking whether delivery costs grow more slowly than adoption.
Net dollar retention was 131%, indicating that the existing customer base generated more recurring revenue than it had in the comparable starting period under the metric's definition. Figma also had 1,717 customers above $100,000 in annual recurring revenue, more than 450 higher year over year. Together, these figures suggest that expansion among established customers remains an important growth engine. They do not guarantee that every customer will renew or that expansion will continue at the same pace. Traders should track retention and large-account growth alongside the cost of serving those accounts. If customer expansion remains broad while margins hold, the combination would support a healthier growth profile than revenue acceleration alone.
Figma raised full-year revenue guidance to $1.497 billion to $1.499 billion, a $33 million increase at the midpoint. It also guided to $158 million to $163 million in non-GAAP operating income. The higher outlook signals management's confidence in near-term demand and its ability to translate some of that demand into adjusted operating profit. Guidance remains a projection, and operating income is a non-GAAP measure. Actual results can differ as customer behavior, spending, and operating costs change. A useful way to assess delivery is to compare later reported results with these ranges and examine whether the company achieves revenue growth without relying on margin assumptions that become harder to maintain.
For Q4, revenue guidance is $402 million to $404 million. At the midpoint, that implies about 33% year-over-year growth. The projected rate is lower than Q3's 43% increase, but the comparison does not by itself show that demand is weakening: growth rates can change with timing, customer mix, and the size of the comparison base. The range also remains guidance rather than a completed result. Traders can monitor actual quarterly revenue against the range, then consider what management says about adoption, customer expansion, and AI delivery costs. A modest shortfall could matter more if accompanied by weaker retention or margin pressure; meeting the range with stable operating performance would offer a different signal.
The after-hours decline confirmed a negative immediate reaction, but the exact percentage move and the cited regular-session gain are unverified and should not be used to measure that reaction. After-hours trading can also be less liquid than regular trading, so its price action may not represent broader market consensus. Figma's results may be assessed differently as investors weigh growth, the GAAP loss, adjusted profitability, and spending on AI. Rather than infer a price target from one reaction, traders can watch how the stock behaves during subsequent regular sessions, whether trading activity broadens, and whether new information changes the balance between demand and delivery costs. Price moves remain uncertain, even when the underlying business figures are clear.
Several developments could shape the next assessment. Continued strong customer expansion, revenue near guidance, and steady cash generation could reinforce confidence in Figma's growth model. Rising AI costs, weaker retention, or pressure on gross margin could challenge that view, especially if adoption does not support greater customer revenue. A mixed outcome is also possible: usage may climb while profitability adjusts as the company builds capacity and improves its own model. These are monitoring scenarios, not predictions. Traders can define in advance what business evidence would change their view, use position sizes consistent with their risk tolerance, and avoid relying on a single earnings figure or after-hours move. NAS100 provides broad technology-sector exposure, not direct exposure to Figma and not a hedge for FIG shares.
Trading Insight
Figma's central test is whether AI adoption and customer expansion can sustain revenue growth while keeping delivery costs manageable. Track reported margins, free cash flow, retention, and results against guidance; NAS100 is a broad technology-index proxy, not a direct substitute for Figma shares or a hedge for FIG.