


Gold's fiscal-fear rally paused for breath this week as spot prices eased back from a three-month high, leaving traders to decide whether the pullback is healthy consolidation or the first sign that momentum is fading before two major catalysts land later in the week. As of the latest available pricing, spot gold traded in a band of roughly $4,600 to $4,640 an ounce after briefly touching $4,680.70 during the prior session, its strongest level since mid-May, while nearby futures contracts pushed as high as $4,696 to $4,700 before sellers stepped back in. The retreat has so far looked more like profit-taking after a strong run than a change in the underlying trend, with bullion having advanced in roughly twelve of the past fifteen sessions.
The rally's foundation rests on a combination of forces that are unusual to see moving together. A softer US dollar, persistent fiscal anxiety in Washington, and renewed friction between the United States and Iran have all pushed capital toward bullion at the same time, effectively stacking several distinct hedges into a single trade. The clearest example of the fiscal angle is the US Treasury's plan to roughly double its liquidity-support buyback operations for longer-dated bonds starting in September. The stated purpose is to smooth trading conditions in the bond market and ease upward pressure on long-term borrowing costs, but many traders have instead read the move through the lens of the so-called debasement trade, the idea that heavier official intervention in debt markets can eventually weigh on a currency's purchasing power, encouraging a rotation into scarce, hard assets such as gold.
That dynamic helps explain why gold has continued to climb even as US Treasury yields stayed elevated, a combination that would normally work against a non-interest-bearing asset like bullion. Ten-year yields have held near 4.70% in recent sessions, a level that in ordinary conditions raises the opportunity cost of holding gold rather than an interest-paying alternative. Instead, fiscal mistrust and dollar softness appear to be outweighing that textbook relationship for now, with the broad dollar index pinned near the 99 handle and making dollar-priced bullion comparatively cheaper for buyers using other currencies. Traders should treat this as a live tension rather than a settled outcome: a genuine stabilization in yields or a firmer dollar could quickly reassert the usual inverse relationship between gold and real rates.
Geopolitics has added a further layer of demand without fully explaining the size of the move on its own. Iran's promise of retaliation following expanded US sanctions keeps a safe-haven bid in the market, since gold traditionally benefits when geopolitical risk rises. Recent history is a useful caution here, however, because Middle East headlines over the past two years have swung from escalation to de-escalation and back again faster than most technical setups can adjust, so any single geopolitical headline should be treated as a catalyst for volatility rather than a durable driver of direction on its own.
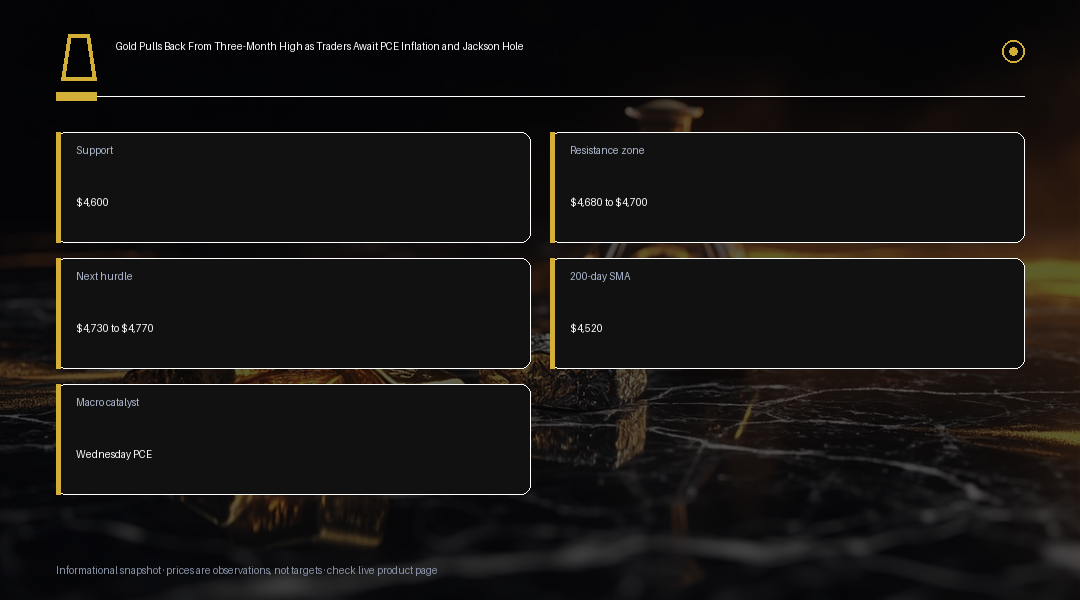
From a technical perspective, the zone between $4,680 and $4,700 is the most important level on the chart right now. A confirmed close above that band, ideally followed by a successful retest, would open the door to a push toward $4,730 to $4,770 and eventually the April peak near $4,890 before the psychologically loaded $5,000 level comes back into view. It is worth stressing that gold's all-time high for 2026 was set near $5,600 an ounce back in January, so even a run at $4,700 would leave prices roughly fifteen to seventeen percent below that record, a useful reminder against treating the current level as unprecedented. On the downside, the immediate support sits around $4,600, backed by a cluster of moving averages that traders are watching closely: the 50-day average near $4,554, the 200-day average close to $4,520, the 100-day average around $4,379, and the 21-day average near $4,323. A slide through $4,600 that also breaches the 50-day average would be the first meaningful sign that the broader uptrend is losing structural support rather than simply consolidating.
Two scheduled events now stand between the market and its next directional move. July's PCE inflation data, the Federal Reserve's preferred inflation gauge, is due Wednesday, with consensus estimates pointing to a monthly increase near 0.2% and an annual core reading close to 3.3%, both figures that should be treated as forecasts rather than realized data until the release actually lands. A softer-than-expected print would tend to weaken both the dollar and yields, potentially giving gold a cleaner run at $4,700 and beyond. A hotter print would cut the other way, reviving talk of a more hawkish Federal Reserve stance and raising the opportunity cost of holding non-yielding bullion, which could trigger a deeper pullback toward or through the moving-average cluster described above.
The second event is Fed Chair Kevin Warsh's appearance at the Jackson Hole symposium on Friday, where markets will be listening closely for signals on the future path of interest rates, the recent stress in long-duration bond markets, and the broader question of central-bank independence given the unusual scale of Treasury intervention already underway. A firmly hawkish tone from Warsh could trigger a wave of profit-taking in gold as real yields firm up, while a more cautious or non-committal tone would likely feed the existing fiscal-fear narrative and keep dip-buyers engaged. Because both catalysts land within roughly 48 hours of each other, traders should expect the potential for outsized, headline-driven moves in either direction rather than the calmer grind that characterized the earlier stages of this rally.
For active traders, the practical takeaway is that gold's medium-term uptrend remains intact as long as the $4,600 support and the underlying moving-average cluster hold, but the next 48 to 72 hours carry more binary risk than the past several weeks combined. Bulls arguing for continuation want to see PCE come in soft and Warsh strike a measured tone, opening a path back toward $4,680 to $4,700 and eventually the $4,890 April high. Bears looking for a deeper correction want a hot inflation print paired with hawkish Jackson Hole commentary, which would put the moving-average support levels under genuine pressure for the first time since the rally began. Either way, position sizing into two back-to-back binary catalysts deserves more caution than a typical single-event week, and traders should have a clear invalidation level in mind before Wednesday's data drops rather than reacting in real time.
Trading Insight
Treat $4,600 as the first line of defense and the $4,680 to $4,700 zone as the key upside gate. A daily close above $4,700 that survives a retest would open a path toward $4,730 to $4,770 and the April high near $4,890, while a break of $4,600 that also takes out the 50-day average near $4,554 would be the clearer signal that the broader uptrend needs reassessment. Wednesday's PCE print and Friday's Jackson Hole remarks from Kevin Warsh are the two catalysts to size risk around; because they land close together, consider tighter position sizing than usual until both have passed and the market has shown its hand.